Money
The Global Distribution of Wealth, Shown in One Pyramid
Visualized: The Global Distribution of Wealth
See visuals like this from many other data creators on our Voronoi app. Download it for free on iOS or Android and discover incredible data-driven charts from a variety of trusted sources.
Key Takeaways
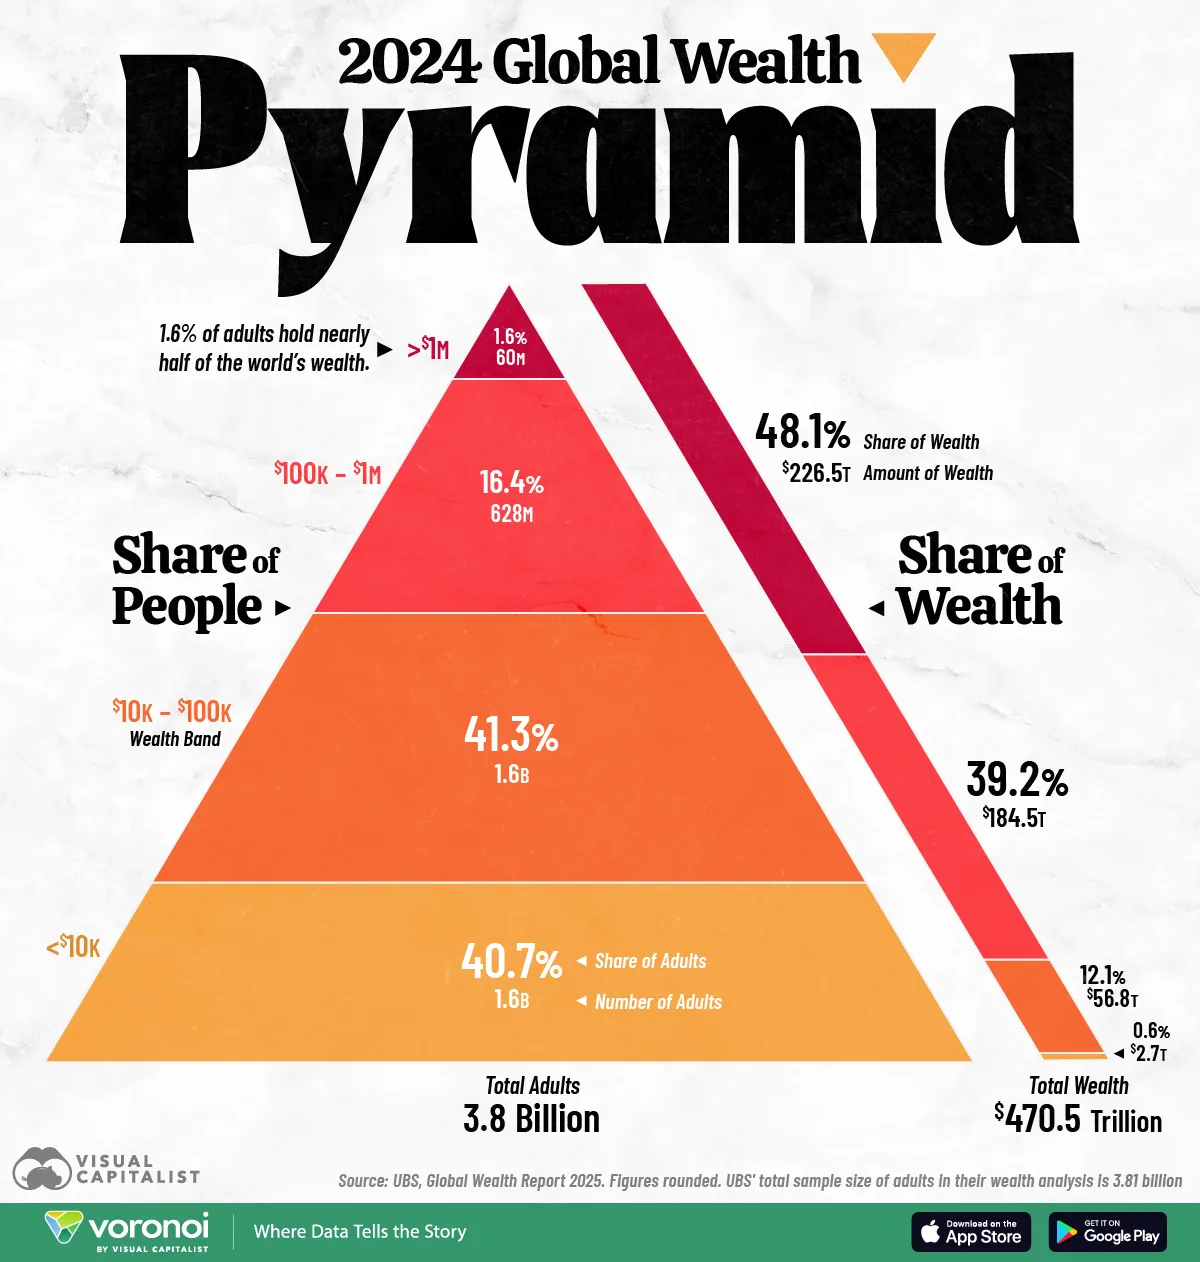
- Just 1.6% of adults worldwide hold nearly 48% of global wealth.
- Almost 3.1 billion adults, or 82% of the world’s adult population, control just 12.7% of total wealth.
- The bottom wealth tier, for those in the $0-$10k wealth bracket, represents 1.55 billion adults but only 0.6% of global wealth.
The world got richer in 2024, with global personal wealth growing by 4.6%. However, the distribution of that wealth remains uneven.
At the top of the global wealth pyramid sits a small elite holding nearly half of the world’s assets, while billions of people in lower tiers own only a sliver of global wealth.
This infographic uses data from UBS’ latest Global Wealth Report to break down the global wealth pyramid by number of people and the share and amount of wealth they hold.
The Data on Wealth Distribution
UBS segments the world’s 3.8 billion adults into four wealth tiers, ranging from those with less than $10,000 to those with more than $1 million, who lie at the top of the global wealth pyramid.
The table below shows how wealth is distributed globally between these four tiers of adults:
| Wealth Band (USD) | Number of Adults | % of Adults | Total Wealth (USD) | % of Wealth |
|---|---|---|---|---|
| >$1 million | 60 million | 1.6% | $226.47 trillion | 48.1% |
| $100k – $1 million | 628 million | 16.4% | $184.51 trillion | 39.2% |
| $10k – $100k | 1.57 billion | 41.3% | $56.82 trillion | 12.1% |
| <$10k | 1.55 billion | 40.7% | $2.71 trillion | 0.6% |
| Total | 3.80 billion | 100.0% | $470.51 trillion | 100.0% |
At the apex of the pyramid, 60 million adults, who make up just 1.6% of the global population, own $226 trillion, or nearly half of all household wealth worldwide.
Beneath the apex, the world’s upper-middle tier (those with $100k–$1M in net worth) includes 628 million adults who collectively hold $184 trillion, representing 39.2% of global wealth.
The largest cohort of adults sits in the middle-lower band: 1.57 billion adults with $10k–$100k, holding a combined $56.8 trillion. Despite accounting for 41% of the world’s population, this cohort owns only 12% of global wealth.
At the base of the pyramid are 1.55 billion adults—40.7% of the population. Together, they hold $2.7 trillion, or 0.6% of global wealth.
Breaking Down the Top of the Wealth Pyramid
Of the 60 million adults at the top of the global wealth pyramid, 2,891 individuals are billionaires, collectively holding over $15.6 trillion in wealth.
| Wealth Band | Number of Individuals | % of Adult Billionaires | Total Wealth (USD) | % of Billionaire Wealth |
|---|---|---|---|---|
| > $100 billion | 15 | 0.5% | $2.35 trillion | 15.0% |
| $50 billion – $100 billion | 16 | 0.6% | $1.15 trillion | 7.3% |
| $1 billion – $50 billion | 2,860 | 98.9% | $12.17 trillion | 77.7% |
| Total | 2,891 | 100.0% | $15.67 trillion | 100.0% |
Of these, just 15 individuals own more than $100 billion in wealth, while another 16 individuals fall in the $50 billion to $100 billion wealth bracket. The remaining 2,860 billionaires have less than $50 billion in wealth.
Learn More on the Voronoi App 
If you enjoyed this infographic, see this visual on Voronoi The World’s Millionaire Population by Country on Voronoi.


Money
Ranked: The World’s Top Billionaire Cities in 2026
New York ranks first with 146 billionaires, but Chinese cities dominate the upper ranks.


Ranked: The World’s Top Billionaire Cities in 2026
See visuals like this from many other data creators on our Voronoi app. Download it for free on iOS or Android and discover data-driven charts from a variety of trusted sources.
Key Takeaways
- New York leads the world with 146 billionaires, the highest concentration of billionaire wealth in any city.
- Chinese cities account for 34% of billionaires across the top 32 cities, with Shenzhen, Shanghai, and Beijing all ranking in the global top four.
- Asia is home to 58% of the billionaires represented in the ranking, highlighting the region’s growing role in wealth creation.
The world’s billionaire population is increasingly concentrated in a small group of global wealth hubs.
Using data from the Hurun Global Rich List 2026, this graphic ranks the cities with the most billionaires worldwide as of January 15, 2026.
While New York remains the world’s billionaire capital, Chinese cities dominate much of the leaderboard. More broadly, Asia accounts for the majority of billionaires across the cities shown, underscoring the region’s expanding influence on global wealth creation.
New York Remains the Global Billionaire Capital
New York remains the world’s billionaire capital with 146 billionaires, but the gap is narrowing. Shenzhen, Shanghai, and Beijing now rank second, third, and fourth globally, giving China three cities within striking distance of New York’s total.
The Big Apple’s dominance is supported by Wall Street, a deep pool of financial services firms, and a thriving ecosystem of private equity, real estate, and technology companies.
| Rank | City | Country | Number of Billionaires |
|---|---|---|---|
| 1 | New York | 🇺🇸 United States | 146 |
| 2 | Shenzhen | 🇨🇳 China | 132 |
| 3 | Shanghai | 🇨🇳 China | 120 |
| 4 | Beijing | 🇨🇳 China | 107 |
| 5 | London | 🇬🇧 United Kingdom | 102 |
| 6 | Mumbai | 🇮🇳 India | 95 |
| 7 | Hong Kong | 🇭🇰 China (SAR) | 88 |
| 8 | San Francisco | 🇺🇸 United States | 86 |
| 9 | Moscow | 🇷🇺 Russia | 82 |
| 10 | Hangzhou | 🇨🇳 China | 65 |
| 11 | New Delhi | 🇮🇳 India | 64 |
| 12 | Singapore | 🇸🇬 Singapore | 59 |
| 13 | Taipei | 🇹🇼 Taiwan | 51 |
| 14 | Paris | 🇫🇷 France | 44 |
| 15 | São Paulo | 🇧🇷 Brazil | 41 |
| 15 | Guangzhou | 🇨🇳 China | 41 |
| 17 | Los Angeles | 🇺🇸 United States | 40 |
| 17 | Bangkok | 🇹🇭 Thailand | 40 |
| 19 | Suzhou | 🇨🇳 China | 39 |
| 20 | Seoul | 🇰🇷 South Korea | 32 |
| 20 | Ningbo | 🇨🇳 China | 32 |
| 20 | Jakarta | 🇮🇩 Indonesia | 32 |
| 23 | Tokyo | 🇯🇵 Japan | 31 |
| 23 | Istanbul | 🇹🇷 Türkiye | 31 |
| 25 | Bengaluru | 🇮🇳 India | 30 |
| 26 | Stockholm | 🇸🇪 Sweden | 29 |
| 27 | Milan | 🇮🇹 Italy | 28 |
| 27 | Dallas | 🇺🇸 United States | 28 |
| 29 | Toronto | 🇨🇦 Canada | 26 |
| 30 | Palm Beach | 🇺🇸 United States | 24 |
| 30 | Melbourne | 🇦🇺 Australia | 24 |
| 30 | Dubai | 🇦🇪 United Arab Emirates | 24 |
Chinese Cities Dominate the Rankings
Shenzhen, Shanghai, and Beijing rank second, third, and fourth globally, with 132, 120, and 107 billionaires, respectively.
China’s presence extends well beyond its largest cities.
Hangzhou, Guangzhou, Suzhou, and Ningbo also appear among the world’s leading billionaire hubs.
Altogether, eight Chinese cities appear in the ranking, accounting for 34% of all billionaires represented.
Asia Emerges as the Center of Billionaire Growth
Asia accounts for 58% of billionaires across the cities shown, making it the dominant region in the ranking.
In addition to China’s strong showing, cities such as Mumbai, New Delhi, Singapore, Taipei, Bangkok, Seoul, Jakarta, and Tokyo all rank among the world’s top billionaire centers.
India’s presence is particularly notable, with Mumbai and New Delhi both placing in the global top 11.
Traditional Wealth Centers Still Matter
Despite Asia’s rise, several long-established wealth centers remain highly influential.
London ranks fifth globally with 102 billionaires, while Moscow, Paris, Milan, Stockholm, and Istanbul all feature prominently.
In North America, San Francisco, Los Angeles, Dallas, Toronto, and Palm Beach continue to attract significant concentrations of wealth.
Meanwhile, Dubai’s inclusion reflects the Middle East’s growing role as a destination for entrepreneurs, investors, and high-net-worth individuals.
Learn More on the Voronoi App
If you enjoyed today’s post, check out Countries With the Most Ultra-Rich Residents in 2026 on Voronoi.
Money
Ranked: The Countries Where $1,000 Takes the Longest to Earn
How many hours does it take to earn $1,000 around the world? See which countries work the least (and most) for their pay.


Ranked: The Countries Where $1,000 Takes the Longest to Earn
See visuals like this from many other data creators on our Voronoi app. Download the app for free on iOS or Android and discover data-driven charts from a variety of trusted sources.
Key Takeaways:
- Workers in Colombia need 86 hours to earn $1,000, compared with just 16 hours in Luxembourg and Iceland.
- The gap between the highest- and lowest-ranked countries exceeds fivefold, even after adjusting for differences in local purchasing power.
- The average American worker needs about 22 hours to earn $1,000, placing the U.S. among the stronger earners in the OECD.
How long would you need to work to earn $1,000? In Colombia, the answer is roughly 86 hours. In Luxembourg and Iceland, it’s just 16.
Using data from the OECD on average annual wages and Our World in Data’s figures for annual working hours, this visualization ranks countries by how long it takes the average worker to earn $1,000.
The figures are expressed in purchasing power parity (PPP)-adjusted dollars, which account for differences in local price levels and make incomes more comparable across countries. Taxes are not included.
How Many Hours of Work Earn $1,000?
Workers in the lowest-ranked countries need more than five times as many hours to earn $1,000 as workers in the highest-ranked countries. The gap ranges from 16 hours in Luxembourg and Iceland to 86 hours in Colombia.
The data table below shows the number of hours worked per $1,000 earned by country in purchasing power parity-adjusted dollars:
| Rank | Country | Hours Worked per $1,000 Earned |
|---|---|---|
| 1 | 🇨🇴 Colombia | 86 |
| 2 | 🇲🇽 Mexico | 78 |
| 3 | 🇬🇷 Greece | 60 |
| 4 | 🇨🇷 Costa Rica | 53 |
| 5 | 🇭🇺 Hungary | 51 |
| 6 | 🇨🇱 Chile | 51 |
| 7 | 🇨🇿 Czechia | 48 |
| 8 | 🇸🇰 Slovakia | 47 |
| 9 | 🇵🇹 Portugal | 45 |
| 10 | 🇵🇱 Poland | 43 |
| 11 | 🇪🇪 Estonia | 42 |
| 12 | 🇱🇻 Latvia | 38 |
| 13 | 🇰🇷 South Korea | 38 |
| 14 | 🇹🇷 Turkey | 37 |
| 15 | 🇮🇱 Israel | 34 |
| 16 | 🇮🇹 Italy | 34 |
| 17 | 🇯🇵 Japan | 34 |
| 18 | 🇱🇹 Lithuania | 33 |
| 19 | 🇪🇸 Spain | 30 |
| 20 | 🇳🇿 New Zealand | 28 |
| 21 | 🇮🇪 Ireland | 27 |
| 22 | 🇸🇮 Slovenia | 27 |
| 23 | 🇫🇮 Finland | 25 |
| 24 | 🇨🇦 Canada | 25 |
| 25 | 🇫🇷 France | 25 |
| 26 | 🇬🇧 United Kingdom | 24 |
| 27 | 🇸🇪 Sweden | 24 |
| 28 | 🇦🇺 Australia | 23 |
| 29 | 🇺🇸 United States | 22 |
| 30 | 🇧🇪 Belgium | 21 |
| 31 | 🇩🇪 Germany | 20 |
| 32 | 🇦🇹 Austria | 20 |
| 33 | 🇩🇰 Denmark | 19 |
| 34 | 🇳🇱 Netherlands | 19 |
| 35 | 🇳🇴 Norway | 19 |
| 36 | 🇨🇭 Switzerland | 18 |
| 37 | 🇮🇸 Iceland | 16 |
| 38 | 🇱🇺 Luxembourg | 16 |
Europe dominates the top of the ranking. Luxembourg, Iceland, Switzerland, Norway, Denmark, and the Netherlands all require fewer than 20 hours of work to earn $1,000.
For comparison, the average American worker needs about 22 hours to earn $1,000, placing the U.S. among the stronger earners but still behind multiple European economies.
Latin America Earns Less While Working More
Colombia and Mexico sit at the bottom of the ranking, requiring 86 and 78 hours of work, respectively, to earn $1,000. Both figures are more than triple the U.S. level and more than four times higher than Luxembourg’s.
While workers in these countries often log similar or even greater annual hours than workers in richer economies, average wages remain substantially lower.
Research highlighted by Our World in Data finds that workers in lower-income countries tend to work longer hours while generating less income per hour worked. Economists point to lower productivity levels, a larger informal sector, reduced access to capital, and weaker wage growth as contributing factors.
Nordic Countries and Luxembourg Stand Out
At the other end of the spectrum are Luxembourg and the Nordic economies. Denmark, Norway, Iceland, and Finland combine relatively high wages with advanced, high-productivity economies.
Analysis from the Becker Friedman Institute and CEPR highlights how strong labor-market institutions, high workforce participation, and substantial investments in education contribute to both high wages and relatively compressed income distributions.
Luxembourg benefits from an especially high concentration of financial and professional services jobs, helping support some of the highest average wage levels in the world.
Why Purchasing Power Matters
The analysis uses purchasing power parity (PPP), which adjusts wages to reflect differences in local price levels. PPP adjustments allow economists to compare what incomes can actually buy in a specific country rather than relying solely on market exchange rates.
Without PPP adjustments, workers in lower-cost countries could appear poorer than they actually are, and vice versa.
Learn More on the Voronoi App
Want to explore wage differences across Europe? Check out Mapped: Average Full-Time Salary in Europe by Country on the Voronoi app.
-
 Energy3 weeks ago
Ranked: Who Controls the World’s Uranium Supply?
-
Misc3 weeks ago
Ranked: The Hardest Languages for English Speakers to Learn
-
Energy1 week ago
Ranked: Where Electricity Costs the Most and Least
-
Money3 days ago
Ranked: The Countries Where $1,000 Takes the Longest to Earn
-
Misc1 week ago
Ranked: Which Countries Americans Like Most—and Least
-
Economy4 weeks ago
Ranked: The Countries Investors Trust Most in 2026
-
Maps5 days ago
Mapped: The Salary Needed to Afford Rent Across America
-
Money3 weeks ago
Ranked: Countries With the Most Ultra-Rich Residents in 2026


